Magna Mining Reports Fourth Quarter and Full Year 2025 Financial Results
Magna Mining Inc. (TSX-V: NICU) (OTCQX: MGMNF) (FSE:8YD) is pleased to report fourth quarter and full year 2025 operating and financial results. All amounts are expressed in Canadian dollars unless otherwise indicated.
Highlights
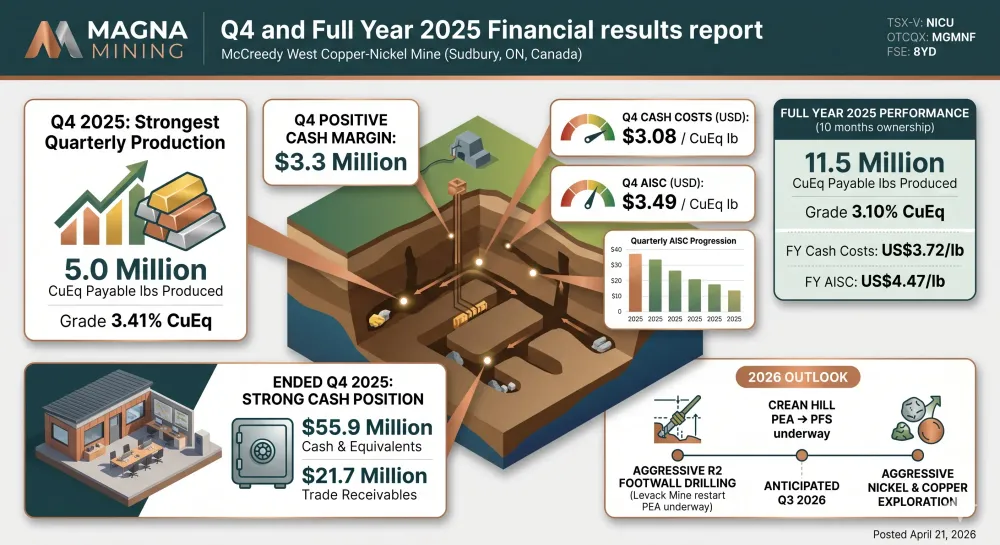
During the three months ended December 31, 2025, Magna successfully achieved a positive cash margin* of $3.3 million at the McCreedy West copper-precious metals-nickel Mine, located in Sudbury, Ontario, Canada.
In Q4 2025, 84,954 tons of ore was processed from the 700 Footwall Copper Zone at McCreedy West (see news release dated January 20, 2026) at a grade of 3.41% copper equivalent1.
The Company produced 5.0 million CuEq payable pounds in Q4 2025, representing the strongest quarterly production at McCreedy West since the Company completed the acquisition of a portfolio of Sudbury assets, including McCreedy West, on February 28, 2025.
Quarterly cash costs* and All-in sustaining costs* of US$3.08 per CuEq lb, and US$3.49 per CuEq lb, respectively.
During the ten months of Company ownership in 2025, McCreedy West produced 11.5 million CuEq payable lbs at a grade of 3.10% CuEq, with cash costs of US$3.72/lb, and AISC of US$4.47/lb.
Total cash margin at McCreedy West in 2025 was $0.4 million.
Ended Q4 2025 with cash and cash equivalents of $55.9 million, after investing $8.2 million in exploration and evaluation expenses in 2025 on Levack and Crean Hill, with the completion of studies on both of these projects scheduled for the third quarter of 2026.
* Refer to the section entitled “Non-IFRS Performance Measures” for the reconciliation of these non-IFRS measurements to the financial statements. “Cash Margin” is calculated as the difference between total sales revenue, net of smelting, refining and treatment costs from mining operations, and the cash mine site operating costs.
Jason Jessup, CEO of Magna, commented, “During the fourth quarter of 2025, Magna cont inued to execute on our underground development plan, with increased diamond drilling and stope availability at McCreedy West. As discussed in the Q3 financial results conference call, the goal of this plan was to access new areas of the mine with better grade stopes, build in consistency and flexibility to the mine plan and position the operation to execute profitable production in 2026. Our fourth quarter results announced today are a result of executing this plan and are a significant improvement quarter over quarter as McCreedy West generated a positive cash margin of $3.3 million during the quarter. On the back of these strong Q4 results, we reiterate our previous operational guidance for 2026, which will be slightly weighted to the second half of 2026 due to stope sequencing. We are well-funded to advance our Levack and Crean Hill projects towards restart and construction decisions, respectively, as well as aggressively diamond drill and expand our R2 Footwall Zone discovery a t Levack, and test new high grade copper targets on our other properties in 2026. In addition, the team at McCreedy West continues to evaluate the potential restart of mining at the nickel-rich Intermain contact-type deposit.”
Table 1: McCreedy West 2025 Tons Processed, Contained CuEq Grades, and CuEq Payable Pounds
| FY 2025 | FY 202 5 | ||||
| Q4 | Q3 | Q2 | Q1 (March only) | ||
| Tons Processed | 84,954 | 75,215 | 70,045 | 20,388 | 250,602 |
| CuEq Grade (%)1 (contained) | 3.41 | 2.64 | 3.26 | 3.01 | 3.10 |
| CuEq lbs1 (payable) | 4,968,000 | 2,735,000 | 3,053,000 | 790,000 | 11,546,000 |
1 Copper equivalent payable pounds and copper equivalent payable grade were calculated using the following US dollar prices:
FY 2025: $4.57/lb Cu, $6.85/lb Ni, $17.95/lb Co, $1,335.09/oz Pt, $1,189.00/oz Pd, $3,583.17/oz Au, $41.82 Ag.
Q4 2025: $5.03/lb Cu, $6.75/lb Ni, $23.01/lb Co, $1,679.68/oz Pt, $1,468.65/oz Pd, $4,141.90/oz Au, $54.83 Ag.
Q3 2025: $4.44/lb Cu, $6.81/lb Ni, $15.90/lb Co, $1,383.49/oz Pt, $1,169.18/oz Pd, $3,455.50/oz Au, $39.38 Ag.
Q2 2025: $4.29/lb Cu, $6.88/lb Ni, $15.81/lb Co, $1,072.35/oz Pt, $990.29/oz Pd, $3,301.29/oz Au, $33.64 Ag.
Q1 2025: $4.40/lb Cu, $7.18/lb Ni, $15.38/lb Co, $944.31/oz Pt, $1,005.61/oz Pd, $3,135.60/oz Au, $34.61 Ag.
Table 2: Q4 and Full Year 2025 Operating and Financial Highlights
| In 000s, except per units and per share amounts | Q4 2025 | Q3 2025 | Q2 2025 | Q1 2025 | FY 2025 |
| Financial results | |||||
| Net revenue from mining operations3 | 24,810 | 14,026 | 15,701 | 4,297 | 58,834 |
| Cash margin1 | 3,313 | (2,041) | (1,191) | 269 | 351 |
| Net income (loss) | (7,108) | (11,597) | (9,317) | 11,039 | (16,983) |
| Adjusted net loss1 | (6,863) | (11,365) | (8,746) | (6,163) | (33,137) |
| Operating cash flow | (10,173) | (10,781) | (11,560) | (2,584) | (35,098) |
| Free cash flow1 | (11,307) | (14,350) | (10,718) | (10,584) | (46,959) |
| Per share information: | |||||
| Net earnings (loss) | (0.03) | (0.05) | (0.05) | 0.06< /td> | (0.07) |
| Adjusted net loss1 | (0.03) | (0.05) | (0.04) | (0.03) | (0.15) |
| Operating cash flow1 | (0.04) | (0.05) | (0.06) | (0.01) | (0.16) |
| Free cash flow1 | (0.05) | (0.07) | (0.05) | (0.05) | (0.22) |
| Selected Financial Statement data | |||||
| Cash and cash equivalents | 55,899 | 63,121 | 27,018 | 38,250 | 55,899 |
| Working capital | 60,499 | 61,917 | 24,404 | 31,890 | 60,499 |
| Total assets | 193,924 | 201,349 | 154,836 | 162,207 | 193,924 |
| Total non-current liabilities | 67,084 | 71,480 | 73,916 | 76,101 | 67,084 |
| Operational results | |||||
| Ore Processed (Dry tons) | |||||
| 700 Copper Zone | 84,954 | 75,215 | 59,100 | 13,911 | 233,180 |
| Intermain Nickel Zone | – | – | 10,945 | 6,477 | 17,422 |
| Throughput | 84,954 | 75,215 | 70,045 | 20,388 | 250,602 |
| Copper Equivalent Grade (%) | |||||
| 700 Copper Zone2 | 3.41 | 2.64 | 3.35 | 3.04 | 3.12 |
| Intermain Nickel Zone2 | 0.00 | 0.00 | 2.77 | 2.96 | 2.84 |
| 3.41 | 2.64 | 3.26 | 3.01 | 3.10 | |
| Metals Payable | |||||
| Copper (000s lbs) | 1,909 | 1,949 | 1,629 | 552 | 6,039 |
| Nickel (000s lbs) | 244 | 193 | 327 | 132 | 896 |
| Cobalt (000s lbs) | 1 | 2 | 4 | 2 | 9 |
| Platinum (ozs) | 1,626 | 479 | 1,156 | – | 3,261 |
| Palladium (ozs) | 1,814 | 641 | 1,218 | 13 | 3,686 |
| Gold (ozs) | 601 | 55 | 284 | – | 940 |
| Silver (ozs) | 23,440 | 13,105 | 9,499 | 1,638 | 47,682 |
| Copper equivalent payable pounds (000s)2 | 4,968 | 2,735 | 3,053 | 790 | 11,546 |
| Per Copper Equivalent Metrics | |||||
| Average realized price (CAD per CuEq payable lb)1,3 | 4.96 | 5.42 | 5.17 | 6.03 | 5.20 |
| Cash costs (CAD per CuEq payable lb)1,2,3 | 4.29 | 6.17 | 5.56 | 5.69 | 5.17 |
| Cash margin (CAD per CuEq payable lb)1 | 0.67 | (0.75) | (0.39) | 0.34 | 0.03 |
| AISC (CAD per CuEq payable lb)1,2,3 | 4.86 | 8.15 | 6.64 | 6.37 | 6.21 |
| Average 1 USD → CAD exchange rates | 1.3947 | 1.3773 | 1.3841 | 1.4359 | 1.3904 |
| Cost Metrics (in USD) | |||||
| Cash costs1,2,3 | 3.08 | 4.48 | 4.02 | 3.97 | 3.72 |
| AISC1,2,3 | 3.49 | 5.92 | 4.80 | 4.43 | 4.47 |
1 Refer to the section entitled “Non-IFRS Performance Measures” for the reconciliation of these non-IFRS measurements to the financial statements.
2 Copper equivalent payable pounds for the purpose of copper equivalent payable grade, cash cost and AISC were calculated using the following US dollar prices:
Q3 2025: $4.44/lb Cu, $6.81/lb Ni, $15.90/lb Co, $1,383.49/oz Pt, $1,169.18/oz Pd, $3,455.50/oz Au, $39.38 Ag.
Q2 2025: $4.29/lb Cu, $6.88/lb Ni, $15.81/lb Co, $1,072.35/oz Pt, $990.29/oz Pd , $3,301.29/oz Au, $33.64 Ag.
Q1 2025: $4.40/lb Cu, $7.18/lb Ni, $15.38/lb Co, $944.31/oz Pt, $1,005.61/oz Pd, $3,135.60/oz Au, $34.61 Ag.
3 The streaming expense has been reclassified from cost of sales to revenue, which has resulted in a reduction in revenue, cost of sales, average realized price per copper equivalent payable pound, cash cost per copper equivalent pound and all-in sustaining costs per copper equivalent payable pound. The Q1 2025 revenue and cost of sales decreased by $0.2 million, while the average realized price, cash cost and all-in sustaining cost decreased by $0.29 (US$0.20) per copper equivalent payable pound. The Q2 2025 revenue and cost of sales decreased by $2.8 million, while the average realized price, cash cost and all-in sustaining cost decreased by $0.91 (US$0.65) per copper equivalent payable pound. The Q3 2025 revenue and cost of sales decreased by $2.4 million, while the average realized price, cash cost and all-in sustaining c ost decreased by $0.86 (US$0.62) per copper equivalent payable pound.
Q4 and 2025 Operating and Financial Details
Payable metal production in Q4 2025 of 5.0 million CuEq payable lbs*, consisting of 1.91 million lbs copper, 0.24 million lbs nickel, 1,626 ounces platinum, 1,814 ounces palladium, 601 ounces gold, and 23,440 ounces silver. 2025 payable metal production of 11.5 million CuEq payable lbs*, consisting of 6.1 million lbs copper, 0.90 million lbs nickel, 3,261 oz platinum, 3,686 oz palladium, 940 oz gold, and 47,682 oz silver.
Q4 2025 CuEq revenue from mining operations was $24.6 million, with 2025 full year CuEq revenue from mining operations of $60.0 million.
Q4 2025 cash costs of US$3.08 per CuEq lb and 2025 cash costs of US$3.72 per CuEq lb.
Q4 2025 AISC of US$3.49 per CuEq lb, which includes $1.1 million of sustaining mine capital development, equipment, and exploration. 2025 AISC of US$4.47 per CuEq lb, including $7.1 million of sustaining mine capital development, equipment, and exploration.
Total cash margin for the quarter was $3.3 million, or $0.67 per CuEq payable lb. 2025 total cash margin of $0.4 million, or $0.03 per CuEq payable lb.
Operating cash flow in the quarter was ($10.2 million) or ($0.04 per share), vs. ($10.8 million) or ($0.05 per share) in Q3 2025.
Free cash flow in the quarter was ($11.3 million) or ($0.05) per share, vs. ($14.4 million) or ($0.07 per share).
2025 exploration and evaluation expenses of $8.2 million, i ncluding $4.6 million at Levack to support the internal Levack Mine restart study and exploration for new footwall deposits, and $1.6 million at Crean Hill to advance the project with power, engineering, commercial discussions and water pre-treatment design/installation activities. A Preliminary Economic Assessment (“PEA”) is now underway on the Levack Mine, and a Pre-Feasibility Study (“PFS”) is underway on the Crean Hill Project, with completion of both studies anticipated in Q3 2026.
Ended Q4 2025 with cash and cash equivalents of $55.9 million, along with $21.7 million in trade receivables from the sale of copper, nickel, cobalt, platinum, palladium, gold, and silver.
*Payable metal production represents the total metal produced at McCreedy West and does not take into account the precious metals stream applicable to gold, platinum, and palladium.
Further details regarding the calcu lation of production costs, cash margins and all in sustaining costs can be found in the quarterly MD&A.
Qualified Person
The scientific or technical information in this press release has been reviewed and approved by David King, M.Sc., P.Geo. Mr. King is the Senior Vice President, Exploration and Geoscience for Magna Mining Inc. and is a qualified person under Canadian National Instrument 43-101.
About Magna Mining Inc.
Magna Mining Inc. is a producing mining company with a strong portfolio of copper, nickel, and precious metals assets located in the world-class Sudbury mining district of Ontario, Canada. The Company’s primary asset is the McCreedy West Mine, currently in production, supported by a pipeline of highly prospective past-producing properties including Levack, Crean Hill, Podolsky, and Shakespeare.
Magna Mining is strategically positioned to unlock long-term shareholder value through continued production, exploration upside, and near-term development opportunities across its asset base.