
Gold plunges $175 in a single session
Gold suffered one of its sharpest single-session losses of the year on Wednesday, shedding $175 per ounce — a decline of 3.87% — as gold futures settled at $4,375. The move rattled investors who had grown accustomed to the precious metal's extended bull run and served as a stark reminder that even the most durable of rallies can unwind with speed when the macroeconomic and geopolitical backdrops shift simultaneously.
Wednesday's selloff was not born from a single catalyst. Rather, it was the convergence of several deteriorating narratives — a diplomatic breakdown in the Middle East, a recalibration of Federal Reserve expectations, and the methodical confirmation of a bearish technical pattern — that conspired to send prices lower in a manner that carries significance well beyond the day's numbers.
For months, escalating tensions in the Middle East had provided a steady underpinning for gold prices, driving the metal to historic highs as investors sought refuge from geopolitical uncertainty. That narrative took a damaging turn this week as Iran publicly characterized the proposed ceasefire framework as "one-sided," effectively signaling that a near-term resolution remains elusive.
Paradoxically, the collapse of peace talks — typically a bullish development for gold — triggered a selloff on Wednesday. Analysts attribute this to a broader re-pricing of risk: sustained conflict in the region carries long-term inflationary consequences, and it is the Federal Reserve's likely response to that inflation, not the conflict itself, that is now driving the gold trade.
With no ceasefire in sight, energy prices remain elevated, supply chain disruptions persist, and consumer price pressures are expected to remain sticky. That reality is forcing bond and commodity traders alike to fundamentally reassess their interest rate assumptions for the remainder of 2026.
According to CME Group's FedWatch Tool, markets are currently assigning approximately a 38% probability to a Federal Reserve rate hike by December 2026 — a dramatic reversal from the rate-cut narrative that had dominated expectations earlier in the year. Meanwhile, roughly 93% of traders expect no change at the Fed's upcoming April meeting, suggesting that policymakers are in a data-dependent holding pattern while inflationary pressures build.
The implications for gold are significant. The precious metal thrives in environments of negative real interest rates and monetary easing. A Fed that is forced to hike — or even one that merely signals a willingness to do so — represents a structural headwind for gold. Higher rates increase the opportunity cost of holding a non-yielding asset, and the dollar tends to strengthen in such an environment, further pressuring dollar-denominated commodities like gold.
This shift in rate expectations represents a meaningful change in market psychology. The consensus view only weeks ago was that persistent geopolitical risk would accelerate Fed easing. Now, the calculus has reversed: if the conflict prolongs inflation, the Fed may be compelled to tighten, not loosen, monetary conditions.
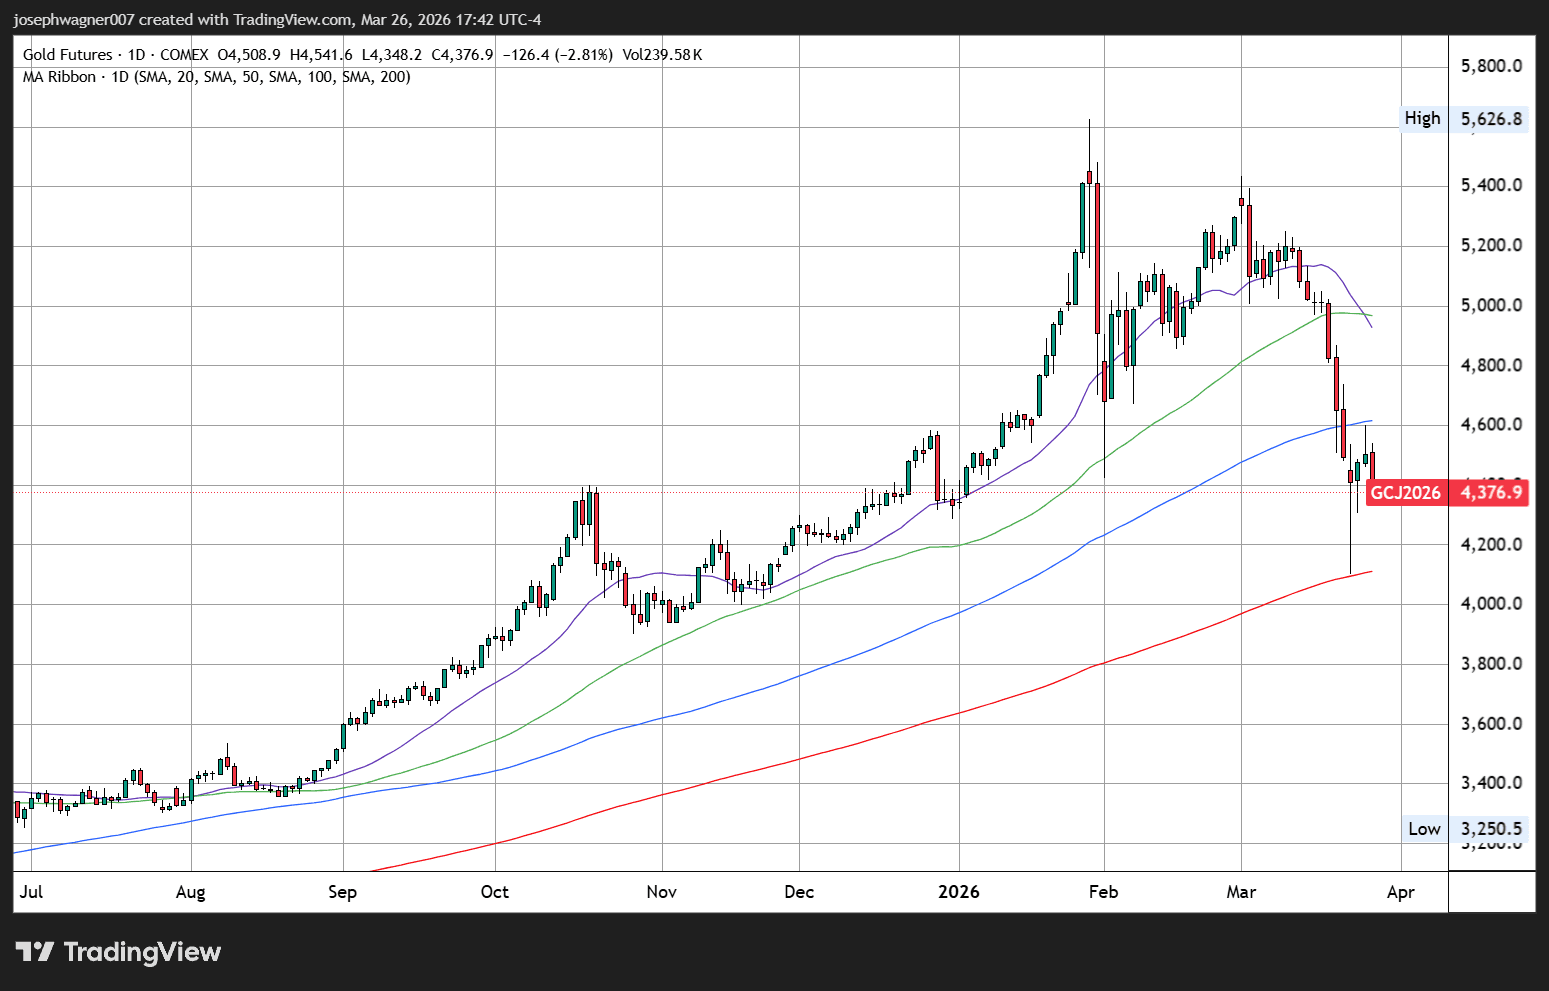
Beyond the fundamental picture, the technical setup for gold has deteriorated materially. Last Friday, prices broke below the closely watched 100-day moving average — a breach that, in isolation, might have been dismissed as a temporary excursion. What happened next made it impossible to ignore.
On Tuesday, gold attempted to recover, but the 100-day moving average — which had previously acted as support — flipped its role entirely and served as overhead resistance. Prices were unable to reclaim the level, and sellers regained control heading into Wednesday's session. This behavior is technically significant: when a formerly supportive moving average becomes a ceiling, it typically indicates that the balance of power has shifted from buyers to sellers.
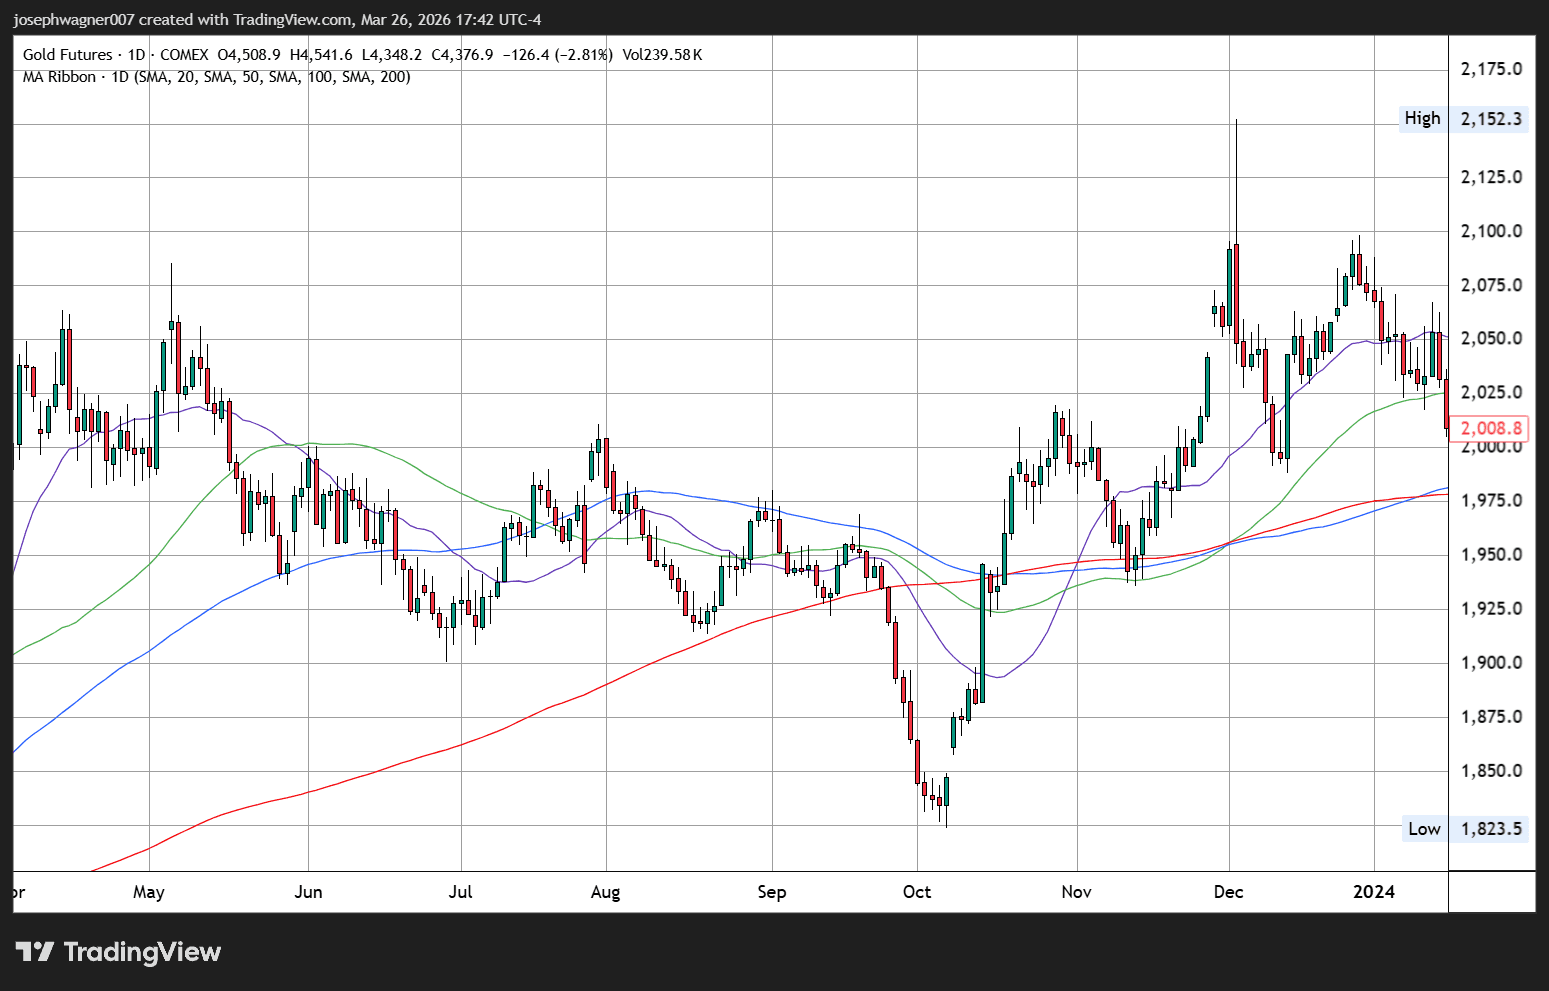
The last time the 100-day moving average acted as resistance was in August 2023, when gold was trading below $2,000 per ounce. That episode preceded a rapid decline from just under $2,000 to $1,800 — a drop of over 10% in a compressed timeframe. The parallel is instructive, not because history repeats with mechanical precision, but because it highlights how rare and consequential it is for gold to enter a genuine bear market configuration. By that measure, this week's price action deserves serious attention.
The next key support level now lies at the 200-day moving average. If that level fails to hold, the technical picture could deteriorate sharply, with limited near-term support visible on the charts.
The convergence of bearish fundamental and technical factors makes the path of least resistance for gold — at least in the near term — one of continued weakness. The diplomatic impasse between the U.S. and Iran shows no signs of resolution. The Federal Reserve faces a policy environment that may require it to lean hawkish just as gold bulls had been counting on easing. And the charts, with their broken support levels and confirmed resistance, offer no technical reason to step in aggressively on the buy side.
None of this is to say that a recovery is impossible. A surprise ceasefire announcement, a sharp deterioration in U.S. economic data, or a significant shift in Fed communication could reverse the narrative quickly. Gold's long-term bull market, driven by sovereign debt concerns and de-dollarization trends, remains structurally intact. But in the immediate term, the weight of evidence suggests that Wednesday's triple-digit decline may be the beginning of a deeper correction rather than a one-day anomaly.
Traders and investors alike would be wise to watch the 200-day moving average closely in the sessions ahead. How gold behaves at that level will go a long way toward determining whether this is a healthy consolidation within a long-term uptrend — or the early stages of something more significant.