
The dollar decides: What the midterm rally in gold and silver says about the next turn
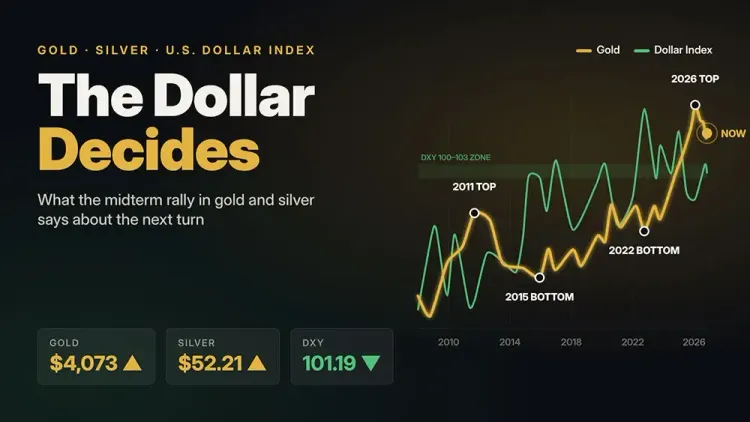
Precious metals surged on Wednesday after Democrats swept both chambers of Congress. Gold gained roughly 3% to about $4,050 an ounce, reclaiming the $4,000 level, while silver jumped close to 5% to near $52. Platinum rose as much as 4.4% to around $1,470, and palladium led the group with a gain of about 6.5% to roughly $995. The common thread was the US Dollar Index, which slid to a five-week low near 101.2 as Treasury yields fell. Markets read the result as gridlock that could stall the administration's tax cut, tariff and deregulation agenda and remove some of the fiscal fuel that has supported the dollar this year. Gold futures finished the session near $4,073, up about 4.5% on the week.
History shows that the winning party matters far less to the metals than what the election does to the dollar. After the November 2010 midterms, when Republicans gained 64 House seats, gold barely moved and fixed near $1,358 the next morning. The result had been widely expected, and the real driver that week was the Federal Reserve's second round of quantitative easing, which kept the dollar soft. Silver still outran gold and set a fresh cycle high near $25.40, and gold finished the following year about 29% above its election day price. Four years later the reaction ran the other way. When Republicans captured the Senate on November 4, 2014, the dollar index rose to a four-year high near 87.60, the dollar hit a seven-year high against the yen, and gold fell 2% to $1,144, its lowest level in more than four and a half years. Silver dropped more than $0.65 to the mid-$15 area. Two Republican waves produced opposite outcomes for gold because the dollar moved in opposite directions.
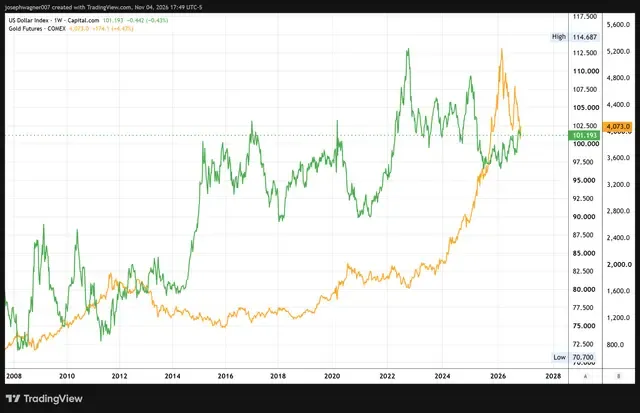
The 2014 election was the spark, but the fuel was monetary policy divergence. The Fed was moving toward its first rate hike while the European Central Bank and the Bank of Japan were expanding stimulus to fight deflation. The dollar index was pressing against its 2009 and 2010 highs near 88 to 89, broke through within weeks, first touched 100 on March 11, 2015, for the first time since April 2003, and peaked at 100.33 two days later. That was a gain of nearly 26% from 79.78 at the end of June 2014. The breakout also set the 100 to 103 zone as the dollar's ceiling for the rest of the decade.
The dollar's advance pushed gold to a six-year low of $1,045.85 in early December 2015, and that low is the most instructive turning point on the long-term chart. On December 16 the Fed raised rates for the first time in nearly a decade. The next day the dollar climbed to a two-week high, gold dropped as much as 2.4% to $1,047.25, just above the earlier low, and silver fell to $13.63. Gold lost about 10% that year, and the strong dollar was cited as the dominant reason. Yet that retest was the bottom. Gold rose about 16% in the first quarter of 2016, its best quarter in nearly 30 years, even though the dollar barely gave ground. The dollar did not make its final high until January 3, 2017, at 103.82, its highest level since December 2002. Gold made a 10-month low at that time but held far above its 2015 low. Gold bottomed more than a year before the dollar peaked, and the tightening cycle that was supposed to crush it marked its low instead. When gold stops falling on dollar strength, the market is signaling that the bad news is priced in.
The same relationship has marked gold's major turns throughout the cycle. Gold's September 2011 record near $1,920 followed a dollar index that had sunk into the low 70s that spring. In March 2020 the dollar spiked to roughly 103, the top of its 2015 to 2020 range, while gold briefly sold off. Five months later gold set a record above $2,000 as the dollar slid. In late September 2022 the dollar index hit its cycle high near 114.7, its strongest level since 2002, and gold fell to about $1,620 that same week. That low launched a rally that carried gold to a record above $5,300 on January 28, 2026, when the dollar sat near a four-year low. Gold tops have arrived with the dollar washed out, and gold bottoms have arrived with the dollar stretched.
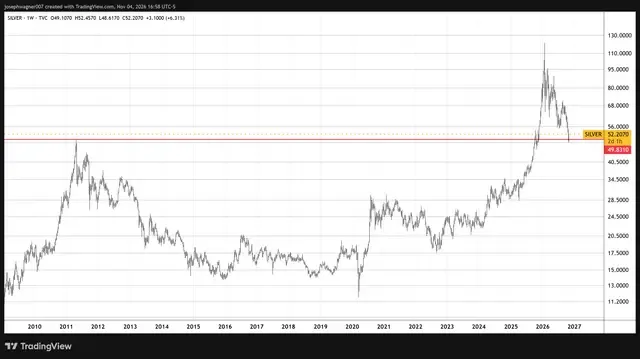
Since January the roles have reversed. The dollar index climbed from its 52-week low of 95.55 to a high of 102.94, a gain of about 7.7%, and pushed back into the underside of the same 100 to 103 zone that once acted as its ceiling and later as its floor. Gold fell more than 26% over that span to a weekly close just under $3,900 last week, and silver gave back more than half of its value from a peak above $100 in early 2026. Even after Wednesday's rebound, gold is down roughly 6% to 7% for the year and silver about 26% to 28%. This is where 2014 comes into focus in reverse. In 2014 the dollar approached a major ceiling from below and an election helped push it through. In 2026 the dollar's rebound has stalled beneath that same ceiling, and an election has helped turn it lower.
Silver adds a second layer to the comparison. Its 2011 high of $49.83 capped the market for more than a decade until silver cleared it in late 2025. This week's candle traded as low as $48.62, briefly beneath that old high, before recovering above $52, a constructive retest of a major breakout level. Silver also offers a warning. After its April 2011 peak near $50, silver collapsed, rebounded 14.2% in October 2011, and then lost 4.5% in November as a firmer dollar and the European debt crisis took hold. Silver fell about 18% this October and has now bounced sharply, so the rebound needs to hold. One difference favors silver today. The gold to silver ratio is near 77, compared with roughly 50 in late 2011, so silver remains far cheaper relative to gold than it was then.
The comparison has limits. An election alone did not create the 2014 dollar bull market. Policy divergence did, and a true mirror image would require the Fed to ease relative to its peers. Today's inflation backdrop does not yet support that. Capital Economics noted that a Fed likely to stay hawkish limits the scope for further gains in gold, and rate hike bets have not disappeared. The 2015 parallel also has differences. Gold had fallen for four straight years and was down about 45% from its peak in 2015, while today's decline has lasted about nine months from a record high. The 2015 dollar stood at a 12-year high, whereas today's dollar remains well below its 2022 peak.
That leaves a clear set of tests. Dollar support sits near 101.25, and a sustained close beneath it would open a path toward the September lows. A weekly close below 100 would confirm that the 2026 rebound failed beneath the old ceiling, the technical inverse of the 2014 breakout and a powerful tailwind for gold and silver. If the dollar instead presses back toward 102.94 while gold holds above its recent low, that divergence would echo the December 2015 retest, when gold refused to break as the dollar strengthened. A new gold low alongside a new dollar high would argue the bottom is not yet in. For silver, the line in the sand is a weekly close above $49.83. Friday's nonfarm payrolls report is the next catalyst for the Fed outlook, the dollar, and the metals that move against it. For anyone interested in more daily articles and videos visit us at TheGoldForecast.com.